
In regression problems, the performance of a model can be evaluated using a variety of metrics, such as R², mean squared error (MSE), and root mean squared error (RMSE). These metrics provide different information about the accuracy and precision of the model's predictions. Below are some tips on how to jointly analyze various metrics and interpret their values.
- Metrics
- R² Score
- Mean Squared Error (MSE)
- Root Mean Squared Error (RMSE)
- Interpreting Multiple Metrics jointly
- Consider error distribution
- Consider size of the data set
- Compare metrics across models
- Check the significance of the difference between models
- Examine the correlation between metrics
- Check for outliers
- Evaluate the metrics in the context of the problem
- Use visualizations
- Use domain knowledge
- Consider the trade-off between accuracy and interpretability
- Consider the data distribution
- Look beyond the mean
- Choose metrics based on the problem
- Summary
Metrics
R² Score
The R² score is a measure of how well the model fits the data. It represents the proportion of the variance in the dependent variable that is explained by the independent variables in the model. The R² score ranges from 0 to 1, where a score of 1 indicates a perfect fit of the model to the data.
The formula for R² is:
where \(y_i\) is the actual value of the dependent variable, \(\hat{y_i}\) is the predicted value of the dependent variable, \(\bar{y}\) is the mean of the actual values, and \(n\) is the number of observations.
Interpreting the R² score can be tricky. A high R² score does not necessarily mean that the model is accurate or reliable.
In some cases, a high R² score can be obtained even if the model has significant errors in its predictions.
For example, if the model is overfitting the data, it may have a high R² score but perform poorly on new data. Similarly, if the model is underfitting the data, it may have a low R² score but still be accurate.
Mean Squared Error (MSE)
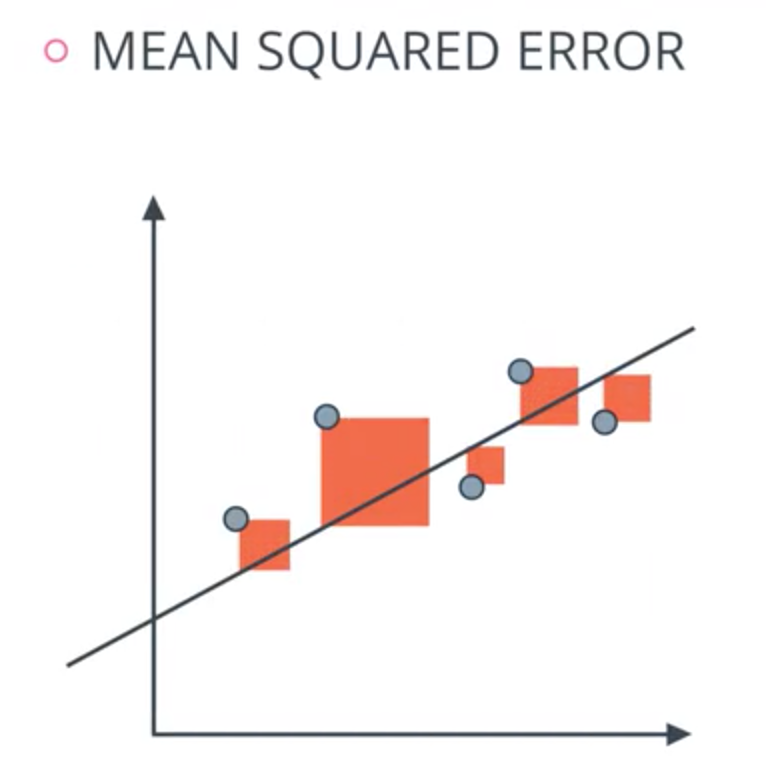
The MSE is a measure of the average squared difference between the predicted values and the actual values. The formula for MSE is:
where \(y_i\) is the actual value of the dependent variable, \(\hat{y_i}\) is the predicted value of the dependent variable, and \(n\) is the number of observations.
Graphical interpretation - square of the distance of the points to line.
 source: Model Evaluation and Validation | Tuk Tak
The MSE can be used to compare the performance of different models. A lower MSE indicates better performance. However, the MSE is sensitive to outliers and can be skewed by extreme values.
Root Mean Squared Error (RMSE)
The RMSE is a measure of the average magnitude of the errors in the predictions. It is the square root of the MSE. The formula for RMSE is:
\(RMSE = \sqrt{\frac{1}{n} \sum_{i=1}^n (y_i - \hat{y_i})^2}\)
The RMSE is easier to interpret than the MSE because it is in the same units as the dependent variable. A lower RMSE indicates better performance. However, like the MSE, the RMSE is sensitive to outliers and can be skewed by extreme values.
R² Score
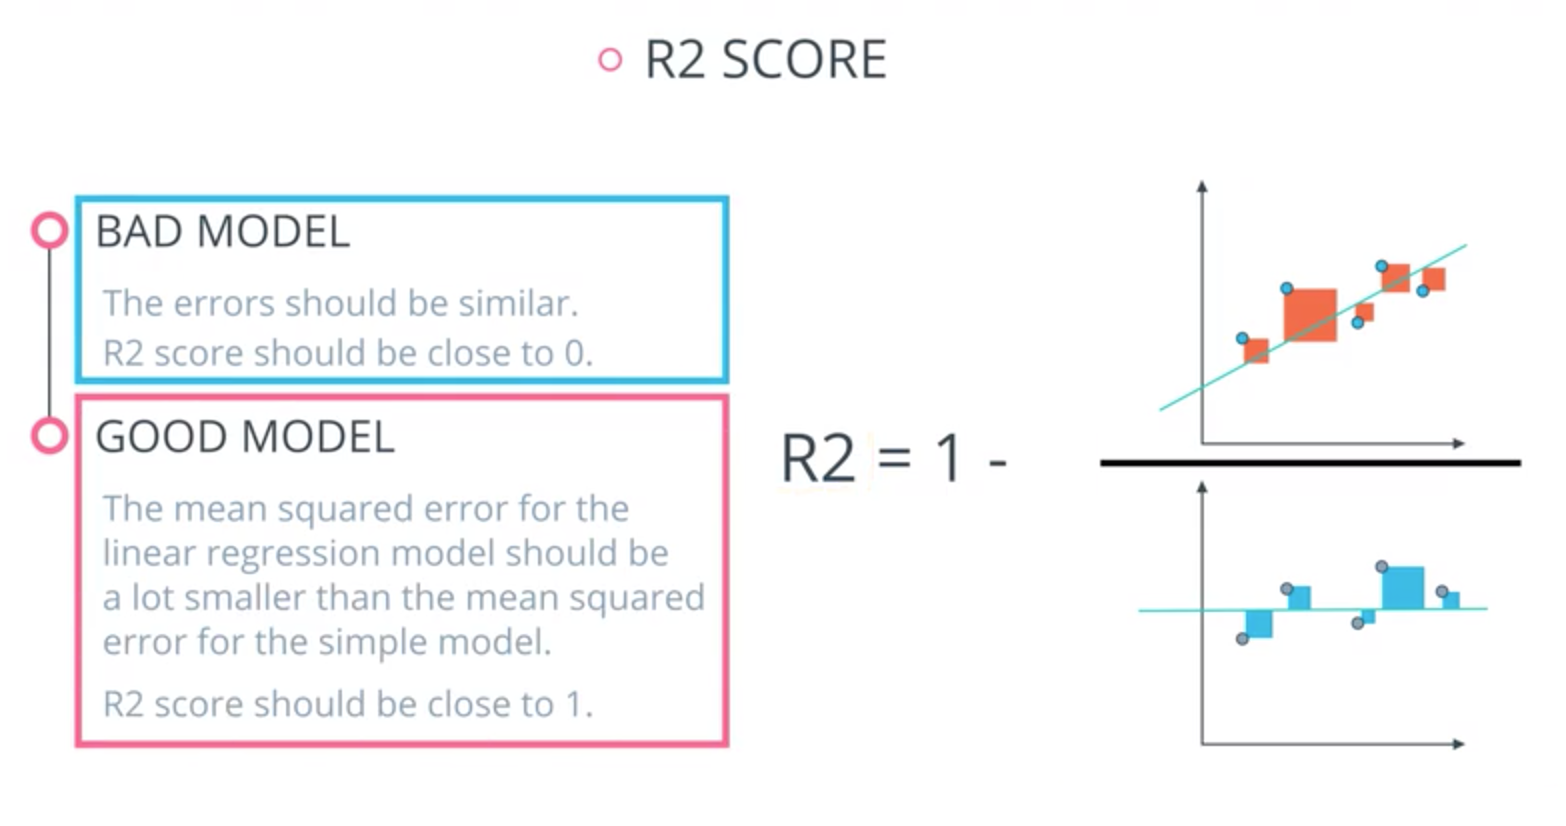
R² Score is based on comparing our model to the simplest possible model. The simplest possible model that fits a bunch of points might be obtained by the averaging of all the values and drawing a horizontal line through them.
 source: Model Evaluation and Validation | Tuk Tak
- For the weak model MSE should be similar to MSE of simple model and thus R² should be close to zero.
- For the strong model MSE should be much smaller than MSE of simple model and thus R² should be close to one.
Interpreting Multiple Metrics Jointly
When evaluating the performance of a regression model, it is important to consider multiple metrics to obtain a more complete picture of the model's performance. In some cases, a single metric can be misleading. Different metrics can provide different perspectives on the model's performance. However, simply looking at the values of the metrics can be insufficient, as it can be challenging to interpret what these values mean in practical terms. Below are some tips on how to jointly analyze various metrics and interpret their values.
For example, consider a model that predicts the price of a house based on its square footage. If the model has a high R² score, it may seem like a good fit for the data. However, if the model has a high MSE or RMSE, it may be making large errors in its predictions that are not captured by the R² score. In this case, it would be useful to examine the distribution of the errors to see if there are any patterns.
Consider error distribution
If the errors are normally distributed, the MSE and RMSE may provide a more accurate assessment of the model's performance than the R² score alone. If the MSE or RMSE is high, it may indicate that the model is not performing well, even if the R² score is high.
Consider size of the data set
Another consideration when evaluating a regression model is the size of the data set. With a large data set, even small errors can result in a high MSE or RMSE. In this case, it may be more useful to look at the percentage of errors, such as the mean absolute percentage error (MAPE) or the mean percentage error (MPE). These metrics can provide a more accurate assessment of the model's performance when dealing with large data sets.
Compare metrics across models
To compare the performance of multiple regression models, it is essential to evaluate the metrics across all the models. For example, if model A has a lower RMSE and higher R² score than model B, it is reasonable to conclude that model A is the better performer.
Check the significance of the difference between models
If there is a small difference between the values of two or more metrics, it is essential to check whether the difference is statistically significant or not. This can be done using statistical tests such as the t-test, ANOVA, or Wilcoxon rank-sum test. If the difference is not significant, it may not be worthwhile to conclude that one model is superior to the other.
Examine the correlation between metrics
Metrics are often correlated, meaning that high values of one metric are associated with high values of another metric. For example, high R² scores are typically associated with low RMSE values. Understanding these correlations can help to interpret the metrics better and determine which metrics to prioritize in evaluating the model's performance.
Check for outliers
Metrics can be skewed by outliers, which are extreme values that lie far from the majority of the data. It is important to check for outliers and remove them if possible, as they can distort the metrics and lead to incorrect conclusions about the model's performance.
Evaluate the metrics in the context of the problem
Metrics should be interpreted in the context of the specific problem being solved. For example, a model with a high R² score but high RMSE may be more appropriate if minimizing the number of large errors is more important than minimizing the overall error. In contrast, a model with a lower R² score but lower RMSE may be more appropriate if minimizing the overall error is more important.
Use visualizations
Graphs and charts can be useful tools for visualizing the performance of different models and the relationship between different metrics. For example, a scatter plot of predicted versus actual values can help identify any patterns or trends in the model's predictions.
Use domain knowledge
Understanding the problem being solved and the domain in which it operates can help in the interpretation of the metrics. For example, in a medical diagnosis problem, minimizing false negatives may be more important than minimizing overall error.
Consider the trade-off between accuracy and interpretability
In some cases, a more interpretable model may be preferred over a more accurate one. For example, a linear regression model may be more interpretable than a neural network model, even if the latter has higher accuracy.
Consider the data distribution
Metrics such as MSE and RMSE assume a symmetric distribution of errors. If the errors are not normally distributed, it may be more appropriate to use other metrics such as mean absolute error (MAE) or mean absolute percentage error (MAPE).
Look beyond the mean
In addition to evaluating the mean value of a metric, it can be useful to examine the distribution of values. For example, examining the distribution of prediction errors can help identify any systematic bias in the model's predictions.
Choose metrics based on the problem
Different metrics may be more appropriate for different regression problems. For example, in a time-series forecasting problem, metrics such as mean absolute scaled error (MASE) or symmetric mean absolute percentage error (SMAPE) may be more appropriate than R² or RMSE.
Summary
When evaluating the performance of a regression model, it is important to consider multiple metrics and not rely on a single metric alone. The R² score, MSE, and RMSE are common metrics used to evaluate regression models, but each provides a different perspective on the model's performance. By examining multiple metrics and considering the size of the data set, it is possible to obtain a more accurate assessment of the model's performance. Analyzing the performance of a regression model requires looking at multiple metrics and understanding their relationship to each other and the problem being solved.
Any comments or suggestions? Let me know.